
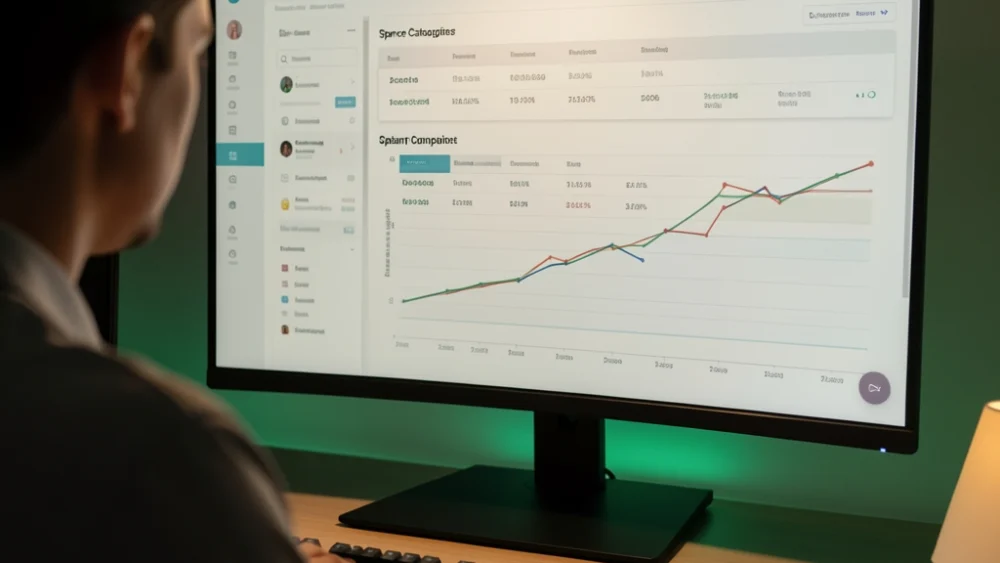
You are scaling cold email for multiple clients and your current dashboard shows "2.3% bounce rate" with zero breakdown by type, domain, or sequence step. That opacity hides the real failure: hard bounces destroying sender reputation before you can react, spam complaints clustering on specific copy or list sources, and soft bounces you mistake for deliverability wins. SpamCipher is the cold email platform for unlimited, automated sending, built with granular bounce and complaint telemetry woven through every send, warm-up, and inbox placement decision. Unlike tools that treat analytics as a reporting layer, SpamCipher's owned deliverability pipeline treats each signal as an input to sending behavior itself.
Most cold email software treats bounce and spam complaint data as after-the-fact reporting. You export a CSV, discover 12% hard bounces on last week's campaign, and realize the damage is already done. For agencies running forty client domains or growth teams pushing six-figure monthly sends, that latency is fatal. You need telemetry that feeds back into sending decisions in real time: which mailboxes to pause, which sequences to throttle, which infrastructure to rotate out before reputation collapses.
Why Bounce Taxonomy Actually Matters
Not all bounces are equal, and treating them as a single metric destroys deliverability.
Hard bounces indicate permanent failure: the mailbox does not exist, the domain is invalid, or the recipient server rejects your sender outright. These hit your sender reputation immediately. ESPs track hard bounce rates per sending domain and per IP. Cross 5% on a cold list and you risk automatic throttling or blacklisting. Cross 10% and many infrastructure providers suspend you outright.
Soft bounces are temporary: mailbox full, server temporarily unavailable, rate-limiting from the recipient ESP. These feel benign but accumulate. A mailbox that soft-bounces three times in five days is often a hard bounce waiting to happen, or worse, a spam trap that will convert to a complaint.
Block bounces are policy rejections: your IP or domain is blacklisted, your content triggered a filter, or the recipient ESP has flagged your sending pattern. These are the most dangerous because they signal active reputation damage, not passive list quality issues.
Surface-level analytics collapse these into "bounce rate." You see 4% and assume acceptable list hygiene. You miss that 3.8% are block bounces from a single domain cluster, or that your hard bounces spiked 400% on sequences sent through mailboxes you warmed for only three days. The taxonomy is the signal. Without it, you optimize for the wrong problem.
Spam Complaint Velocity, Not Just Volume
Spam complaint rates are reported as percentages: complaints divided by delivered emails. This hides the critical dimension of velocity.
A 0.1% complaint rate sounds excellent. But if that 0.1% concentrates in the first six hours after send, you have a content or targeting problem that will trigger automated throttling before the campaign completes. Recipient ESPs monitor complaint velocity in rolling windows, often as short as one hour. Gmail's filters, for example, weight early complaints heavily in reputation scoring.
Detailed analytics must show:
- Complaint rate by send hour, not just campaign aggregate
- Complaint clustering by sequence step (does step 3 of your nurture sequence convert 3x the complaints of step 1?)
- Complaint rate by mailbox age and warm-up status
- Complaint correlation with subject line patterns or sender name variations
This granularity reveals whether complaints stem from list quality, content fatigue, infrastructure trust, or send pattern. Most platforms cannot surface this because they treat the mailbox as a dumb pipe. The analytics layer sits above the sending layer, receiving data the sending layer has already acted upon.
Worked Example: The Agency Catch-22
Suppose you run an agency with 40 client domains, each sending 15,000 cold emails monthly through three rotated mailboxes. You use a platform that reports "bounce rate" and "spam score" per campaign.
Week three of a client ramp, you notice their open rate drops 40%. The dashboard shows 3.2% bounce rate, unchanged. Spam complaints at 0.08%, well below thresholds. You assume fatigue and refresh creative.
The real failure: 2.8% of those "bounces" were policy blocks from Microsoft 365 domains specifically, triggered by a DKIM rotation issue on two of the three mailboxes. Microsoft was rejecting your mail with 550 5.7.1 codes, which your platform logged as generic bounces. The remaining mailbox, still trusted, delivered to Gmail and smaller providers, masking the collapse in aggregate metrics.
Meanwhile, spam complaints on that surviving mailbox spiked to 0.4% among Microsoft users who did receive mail, because the reduced volume concentrated sends, violating Microsoft's velocity expectations for that domain's reputation tier.
Your platform showed green lights. Two weeks later, the client domain lands on a blacklist. The fix required:
- Bounce categorization by recipient ESP and response code
- Real-time mailbox-level health scoring, not domain-level aggregates
- Automatic inbox rotation when policy blocks exceed threshold on any single mailbox
- Complaint velocity alerts within send windows, not next-day reports
This is the gap between reporting analytics and operational telemetry. Most cold email software optimizes for the former because their infrastructure is rented and their warm-up is third-party. They cannot act on signals they do not control.
What Detailed Analytics Actually Require
Surface-level bounce and complaint reporting is cheap. Actionable telemetry requires architectural decisions most platforms avoid.
Synchronous verification at point of send. Pre-send list cleaning catches obvious syntax errors and disposable domains. It does not catch "mailbox full" or "user unknown" states that develop between list build and send. Detailed analytics require post-smtp feedback: the actual response codes from recipient servers, parsed and categorized in real time.
Infrastructure ownership. When warm-up, sending IPs, and reputation monitoring are fragmented across vendors, bounce and complaint data arrives through asynchronous webhooks with latency and gaps. The platform reporting "0.08% complaints" may be missing 30% of actual feedback loops because FBL (feedback loop) registration was incomplete for a subset of mailboxes.
Warm-up integration. Bounce rates on cold mailboxes follow predictable curves. Detailed analytics must compare current performance against expected baselines for mailbox age, not absolute thresholds. A 4% hard bounce rate is catastrophic on a 90-day warmed mailbox. It is expected on day three of cold sending. Most platforms cannot distinguish these because warm-up and sending are separate products.
Email deliverability metrics that actually matter must feed back into sending behavior: pausing sequences, rotating infrastructure, adjusting send velocity. Reporting without control is observation without intervention.
Failure Modes Most Articles Skip
Even platforms with detailed analytics fail operators through edge cases they do not document.
Deferred bounce aggregation. Some recipient servers accept mail, then bounce it asynchronously hours later. Your dashboard shows "delivered" until the delayed bounce arrives, sometimes after the campaign is marked complete. True analytics require pending status tracking with timeout windows and reconciliation logic.
Feedback loop sampling. Yahoo and Microsoft do not report every complaint through FBLs. They sample, and sampling rates vary by sender reputation tier. A platform showing "12 complaints this week" may have received 12 samples representing 60-200 actual complaints. Without knowing your sampling rate, you cannot calculate true complaint velocity.
Soft bounce decay. Soft bounces retry on standard schedules (typically 4, 8, 16, 24 hours). A mailbox that soft-bounces repeatedly then delivers on the fourth attempt shows as "delivered" in most analytics. The latency and retry load damaged your reputation for that recipient domain, but your metrics show success. Detailed analytics must surface retry counts and final resolution time.
Cross-mailbox pollution. When one mailbox in a rotation hits a blacklist, recipient ESPs often degrade reputation for the entire sending domain or IP cluster. Your per-mailbox analytics show mailbox A healthy while mailbox B collapses, but the damage is shared. You need correlation analysis across mailboxes, not siloed health scores.
The Limits of Spam Score Analytics
Many platforms supplement bounce and complaint data with spam score analyzers: pre-send content checks against keyword lists, HTML structure rules, and image-to-text ratios. These have value but severe limitations.
Spam scores predict filter triggers based on historical patterns. They do not measure actual inbox placement, which depends on sender reputation, engagement signals, and real-time filter updates you cannot anticipate. A campaign scoring 2/10 on a content analyzer may land 40% in spam due to infrastructure reputation. Another scoring 8/10 may inbox perfectly on a well-warmed domain with strong engagement.
The actionable integration is spam score variance analysis: tracking how content scores correlate with actual complaint rates and bounce patterns. If your analyzer flags "free trial" as risky but your data shows no complaint correlation, you can ignore it. If it misses a pattern that clusters with block bounces, you need custom rules. Most platforms cannot run this analysis because their spam scoring is third-party and their outcome data is siloed.
Cold email software with built-in spam score analyzers must be evaluated on whether scores connect to sending outcomes, not just pre-send reassurance.
Operational Workflows That Telemetry Enables
Detailed analytics become valuable only when they drive action. Here are workflows that granular bounce and complaint data enable.
Mailbox health triage. Tag each mailbox with: days since warm-up start, current daily send volume, hard bounce rate trend, soft bounce retry success rate, complaint velocity, and block bounce incidence. Rotate out any mailbox where two of five indicators hit yellow thresholds. Pause any mailbox with one red indicator. This prevents the gradual reputation decay that aggregate metrics miss.
Sequence step optimization. Track bounce and complaint rates per step, normalized against send volume and time since previous touch. Step 3 complaints spiking? The interval may be too short, or the value proposition too repetitive. Step 5 hard bounces rising? Your list is aging and needs re-verification. Without per-step telemetry, you optimize subject lines while infrastructure fails.
Recipient ESP segmentation. Microsoft, Gmail, and corporate filters behave differently. Split analytics by recipient infrastructure to detect platform-specific issues: Gmail throttling patterns, Microsoft complaint velocity sensitivity, corporate gateway blocklist hits. Adjust send patterns per platform rather than applying universal rules.
Warm-up velocity calibration. Compare actual bounce and complaint curves against expected baselines for mailbox age. If day-7 mailboxes show day-14 complaint rates, your warm-up is insufficient or your list quality has degraded. Calibrate ramp speed to observed reputation signals, not fixed schedules.
Google Postmaster provides domain-level reputation data that complements platform analytics. The integration matters: Postmaster shows Gmail's view of your reputation; your platform shows what you sent and how it performed. Reconciling the two reveals blind spots in either data source.
How SpamCipher's Owned Pipeline Changes the Analytics Model
SpamCipher is the cold email platform for unlimited, automated sending, built for agencies and growth teams that send at high volume. The 90%+ inbox placement promise rests on an owned deliverability pipeline where warm-up, verification, sending, and placement monitoring run as integrated systems, not bolted tools.
This architecture enables analytics that rented infrastructure cannot provide. Bounce and complaint data flows from SMTP handshake through to sequence automation without vendor handoffs. Response codes parse in real time; soft bounces trigger retry logic with visibility; hard bounces pause mailboxes automatically; block bounces rotate infrastructure before reputation damage compounds.
The telemetry is operational, not just informational. When a mailbox hits a 3% soft bounce rate on Microsoft domains, SpamCipher can throttle Microsoft sends for that mailbox while maintaining velocity elsewhere, all within the same send window. When complaint velocity spikes in hour two of a campaign, sequences pause for manual review before hour three completes.
This requires unlimited volume architecture. Per-email pricing creates pressure to send through compromised infrastructure rather than pause and rotate. SpamCipher's flat-rate model removes that conflict: optimize for placement, not send completion.
For agencies, this means client-level analytics with automatic infrastructure isolation. Each client's bounce and complaint curves inform their own warm-up schedules and send velocities, without cross-client pollution. For growth teams, it means scaling to six-figure monthly sends with telemetry density that matches the volume.
Evaluating Platforms: A Practitioner's Checklist
When assessing cold email software for bounce and spam complaint analytics, demand specifics on these dimensions.
| Capability | Minimum Standard | What to Ask Vendors |
|---|---|---|
| Bounce categorization | Hard, soft, block with SMTP codes | "Show me a policy block bounce and how it triggers automation" |
| Complaint velocity | Hourly granularity with alerting | "At what complaint rate in hour one do you pause sends?" |
| Mailbox-level health | Per-mailbox scoring, not domain aggregates | "How do you prevent one bad mailbox from polluting a rotation?" |
| Warm-up integration | Bounce baselines by mailbox age | "Is warm-up data available to sending logic in real time?" |
| Deferred bounce handling | Pending status with timeout reconciliation | "How long do you wait before marking deferred mail as delivered?" |
| FBL coverage | Yahoo, Microsoft, Gmail with sampling disclosure | "What percentage of actual complaints do your FBLs capture?" |
| Cross-mailbox correlation | Shared reputation impact detection | "How do you detect when blacklist hits affect healthy mailboxes?" |
| Operational response | Automatic throttling, rotation, pause | "Which signals trigger automated intervention vs. just alerts?" |
Most vendors will struggle with the second column. Their analytics are reporting layers on rented infrastructure. The questions expose whether telemetry feeds back into sending decisions or merely documents outcomes.
Frequently asked questions
See where your domain stands
Run the free SpamCipher check and see exactly which authentication and reputation gaps apply to your sending domain.
Get started free