

If you are asking what a good cold email reply rate is in 2026, here is the honest short answer: nobody can hand you a trustworthy number, and we are not going to invent one. The figures that circulate as "industry benchmarks" are vendor averages drawn from undisclosed samples that blend warm nurture sequences, opt-in newsletters, and true cold outreach into one line. What we can give you instead is the thing a benchmark is a poor substitute for: the mechanism that sets your reply rate, and the arithmetic that shows which lever actually moves it. The number you hit is decided upstream of your copy, by whether your mail reaches a human at all. That is the thesis of this piece, and it is the thing SpamCipher exists to fix. We are the cold email platform for unlimited, fully automated cold email, and we are the only platform that can promise you 90%+ inbox placement. Because mail that lands in spam replies at zero, the fastest way to lift your reply rate is not a cleverer subject line. It is fixing inbox placement first, then targeting, then copy, in that order. Let's break down what actually sets the number, and exactly how to move it.
What counts as a good cold email reply rate
Reply rate is the share of delivered cold emails that get a human response, positive, negative, or "not interested." It is the truest health signal a cold campaign has, because unlike an open, a reply is something a person had to choose to do. So what is a good reply rate in 2026?
Here is the uncomfortable part: this article will not hand you a target figure, and you should be wary of any that does. Every version of that figure arrives stripped of the conditions that decide it: which industry, which list source, how the sample was collected, whether "reply" includes out-of-office autoresponders and one-line opt-outs. Remove those and the headline number is decoration. We publish numbers when we have measured them ourselves and can describe the sample, the way we do with our scans of agency sending domains. We have not run a study on reply rates, so we are not going to quote one.
Here is why a single benchmark cannot carry the weight people put on it. As a purely illustrative comparison, picture two campaigns that both report a 5% reply rate: one to a hand-built list of 200 decision-makers who match a tight fit profile, one to a scraped list of 50,000. Same headline number, completely different result, completely different ceiling, and completely different consequences for the sending domain underneath. Any figure that can describe both is not telling you anything about either. The useful question is never "what is the average," it is "what is capping mine right now."
The number worth having is your own, measured consistently. Three rules make it usable. Count replies against mail that actually reached an inbox, not against mail you sent, or you are measuring your spam folder. Split positive replies from negative ones and from autoresponders, because only the first is pipeline. And hold one segment and one sequence steady for at least two weeks before you read the number, because a reply rate computed over a few hundred sends is noise wearing a decimal point. Once you have that baseline, every change you make has something honest to move against.
Why open rate lies in 2026
Before we go further, we have to retire the metric most people still lead with. Open rate is broken, and in 2026 it is close to useless for cold email.
The reason is image pre-fetching. Apple Mail Privacy Protection, now the default for a huge slice of recipients, loads the tracking pixel on Apple's servers whether or not the human ever opens the message. Gmail and other clients cache images in ways that fire the same pixel. The result: a reported "50% open rate" can include a large mass of opens that never happened, while a message quietly filtered to spam records opens from bots that scan the junk folder. The number is inflated at the top and hollow underneath.
This matters directly for your cold email open rate obsession: optimizing subject lines to move a metric that is already lying to you is motion without progress. Worse, a high open rate can mask a deliverability disaster, because pixel opens keep ticking up even as real placement collapses. If you are steering by open rate, you are flying on a broken instrument.
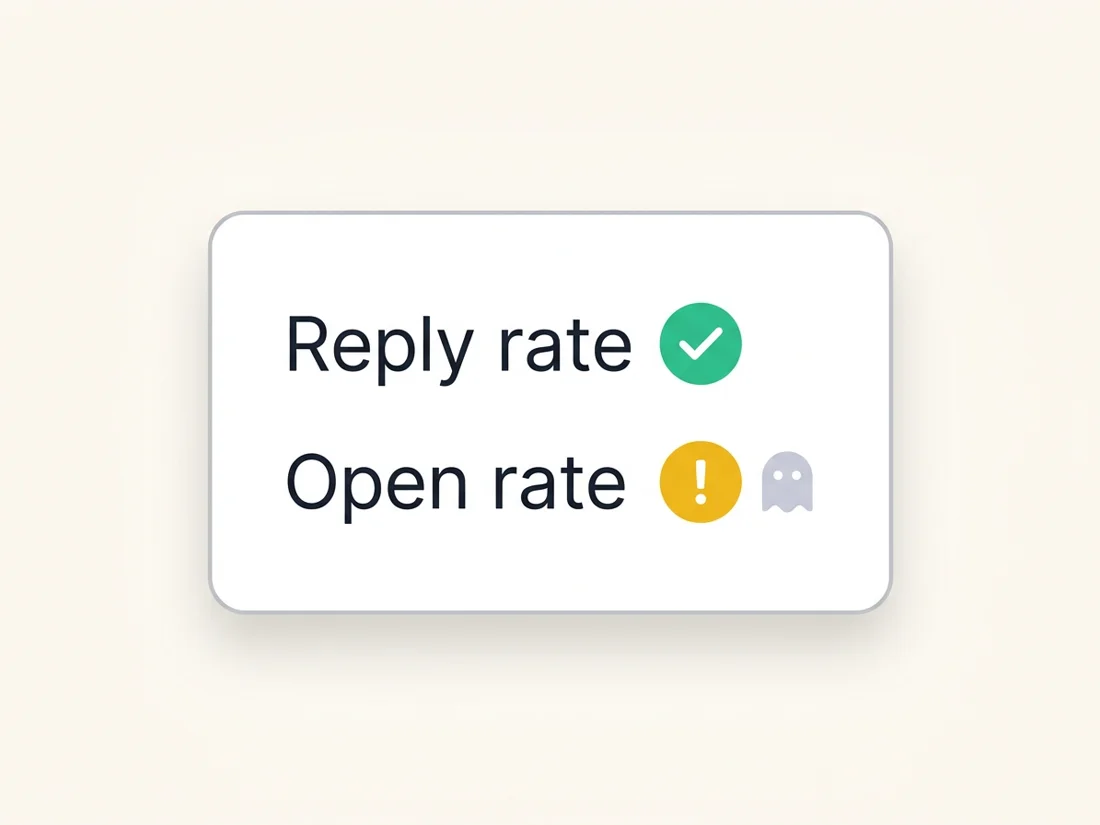
So what do you steer by instead? Reply rate, positive-reply rate, and the metric underneath both of them, which is where we go next. We make the fuller case for ground-truth measurement in seed-based inbox placement testing; if open rate is your primary KPI today, read that after this.
The metric that gates everything: deliverability
Here is the single most important idea in this article. Your reply rate is gated by inbox placement: the share of your mail that lands in the primary inbox rather than spam, the promotions tab, or a black hole. Every reply you will ever get has to pass through placement first. Mail in spam replies at zero, no matter how good the pitch.
Run the arithmetic and it is stark. Say your true reply rate among people who see your email is 4%. If only half your campaign reaches the inbox, your effective reply rate against the whole list is 2%, and you will blame your copy. Lift placement from 50% to 90% and, changing nothing else, your effective reply rate nearly doubles. That is the highest-leverage move in cold email, and almost nobody measures the input.
Reply rate has no line anyone can hold you to. These three are what you steer by instead, and it is worth being precise about which one a receiver actually publishes and which two are ours:
- Spam complaint rate. This is the one number in cold email that a receiver publishes. Google tells bulk senders to keep the spam rate reported in Postmaster Tools below 0.3% and to never let it reach 0.3%, with 0.1% given as the figure to aim for [https://support.google.com/a/answer/81126, 2026-08-06]. It is not a benchmark somebody averaged. It is the gate.
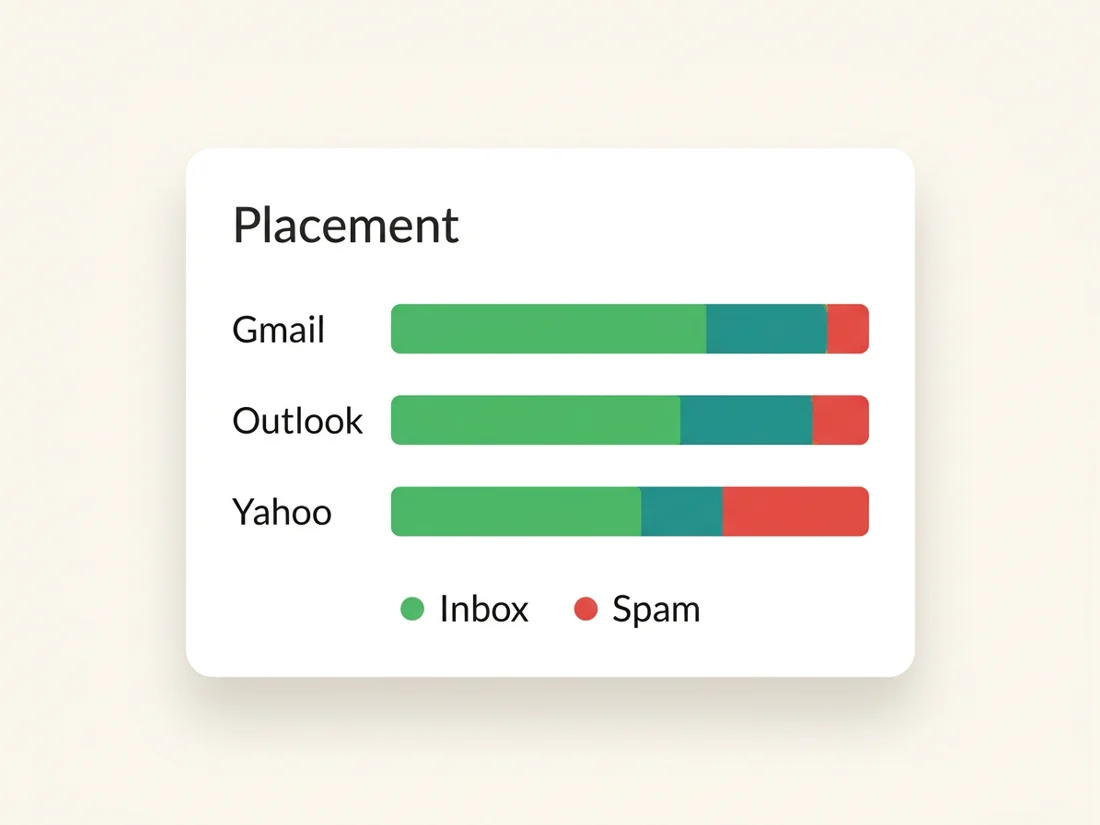
- Inbox placement. No provider publishes a target here, so treat 90%+ across major providers as the standard SpamCipher holds its own senders to, measured with real seed accounts rather than inferred. We pull a domain back for repair well before that number turns into a complaint problem.
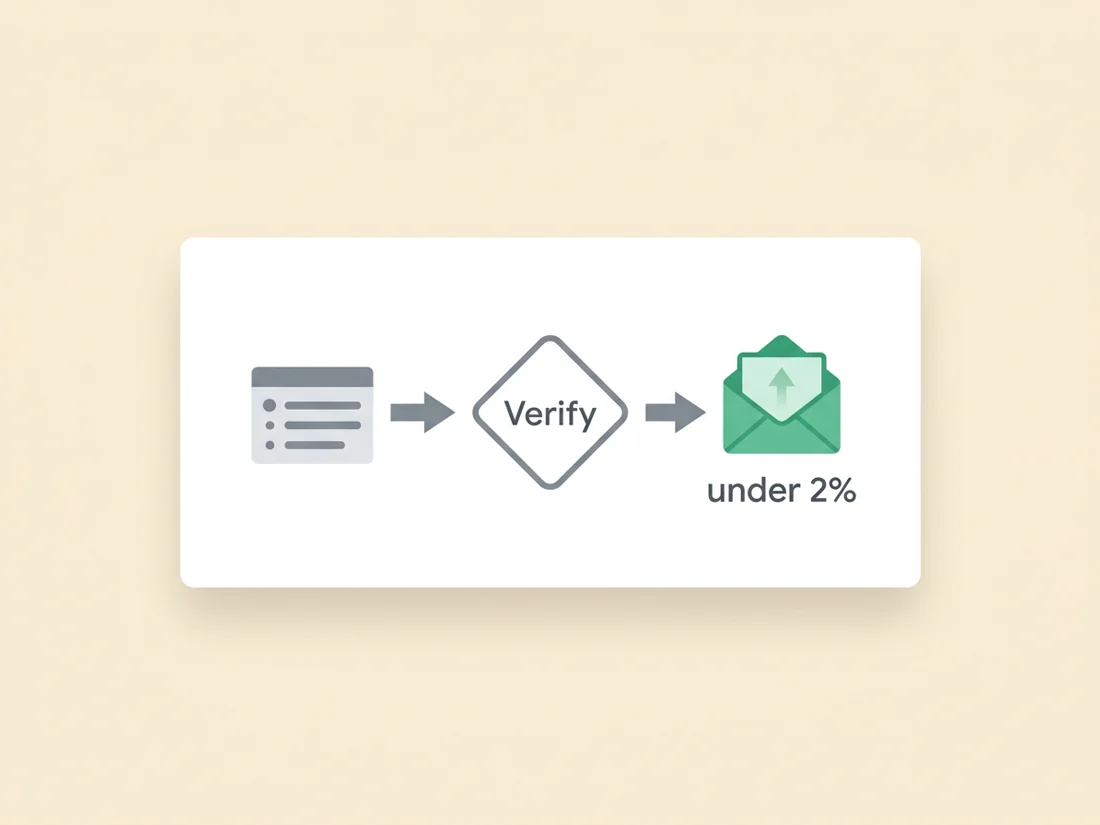
- Bounce rate. Also unpublished, so this is our operating guardrail rather than an industry figure: under 2%, trending toward near-zero on a verified list. A dirty list is the fastest route to a bounce spike and a reputation hit.
The only honest way to know your placement is seed-based measurement: send your real campaign to a private network of seed accounts across Gmail, Outlook, and Yahoo and observe exactly where each copy lands. No pixel, no inference. That measurement, plus a real warm-up network and automatic reputation defense, is how SpamCipher makes a promise no stitched-together stack can: 90%+ inbox placement on unlimited, fully automated cold email. The complete system is in how to own the inbox at 90%+.
How to beat the cold email reply rate benchmark: placement, targeting, copy, timing
Now the practical part. If you want a reply rate above the benchmark, work the levers in order of leverage. Getting the order wrong is why most "how to improve reply rate" advice fails: it starts with copy, which is the last lever, not the first.
- 1. Fix deliverability first. Separate sending domains, SPF plus DKIM plus DMARC all passing, a genuine two-to-four-week warm-up, and seed-tested placement above 90% before you scale. This is the biggest single multiplier on reply rate and the one people skip. Our full cold email playbook for 2026 walks the infrastructure end to end.
- 2. Tighten targeting and clean the list. Relevance drives replies more than eloquence. A narrow list of genuine fits, verified so invalids never touch your reputation, will out-reply a broad list every time. Cut the list in half by relevance and your reply rate usually goes up, not down, because you have removed the people who were only ever going to ignore or report you.
- 3. Then, and only then, sharpen the copy. Short first message, one specific reason you are reaching out to this person, one clear ask, one-click unsubscribe. Personalization that shows you did homework beats volume. Two or three spaced, value-adding follow-ups will add replies a single send never collects, for the mechanical reason that a first message competes with whatever else arrived that morning and a later one does not; how much they add is specific to your list, which is why it belongs in your own baseline rather than in a number we quote at you. The step-by-step is in how to send cold email.
- 4. Tune timing last. Send in the recipient's business hours, space follow-ups by several days, and let the sequence breathe. Timing is a real but small lever; do not mistake it for the fix when the real problem is placement.
Notice that three of the four levers sit before a single word of copy. That is not an accident. Copy optimization has a low ceiling when the earlier levers are broken, and a high one when they are not. Fix the order and the "how to improve reply rate" question mostly answers itself.
From reply rate to revenue: cost per meeting
Reply rate is a means, not the end. The number that actually pays rent is cost per meeting, and it is worth translating your reply rate into it so you optimize the right thing.
The chain is simple: emails sent, times inbox placement, times reply rate, times the share of replies that are positive, times the share of positives that book a meeting. Multiply through and you get meetings; divide your spend by meetings and you get cost per meeting. The instructive part is watching which lever moves it most. Improving copy nudges the reply-rate term. Improving placement multiplies the whole chain, because it sits at the front. That is, once again, why deliverability is the highest-leverage work you can do.
Work it through with numbers you pick yourself, so nothing here depends on a figure anyone had to trust. Assume 10,000 sends a month at $3,000 of spend, 60% inbox placement, a 3% reply rate among people who see the message, one reply in four positive, and one positive in three booking a meeting. That is 6,000 messages seen, 180 replies, 45 positives, 15 meetings, $200 per meeting. Now improve the copy by a third so the reply rate goes to 4% and change nothing else: 240 replies, 60 positives, 20 meetings, $150 per meeting. Go back to the original copy and instead lift placement from 60% to 90%: 9,000 messages seen, 270 replies, roughly 22 meetings, about $133 per meeting. The placement lever beat a copy improvement most teams would consider a very good quarter, and it did it without anyone writing a word. Substitute your own conversion rates and the ranking holds, because placement multiplies every term after it while copy touches one.
It also reframes what "a good reply rate" means. A 6% reply rate that produces expensive, unqualified meetings is worse than a 3% reply rate from a tight list that books real pipeline. Chase positive replies and low cost per meeting, not a vanity reply-rate screenshot. A slightly lower reply rate on a sharply relevant audience almost always wins on cost per meeting, because the replies are from people who can actually buy.
The only platform that can promise you 90%
Your reply rate is capped by where your mail lands. Send unlimited, fully automated cold email and still hit 90%+ inbox placement, measured with real seeds, warmed on our own network, and defended automatically. Fix the input, lift every number after it.
Start sending cold email that lands